DAX RANKX function – Part II

In a previous post, I explained how to use RANKX function to calculate revenue ranking for each provider in each department. In this post I’m going to explain how to rank at different levels.

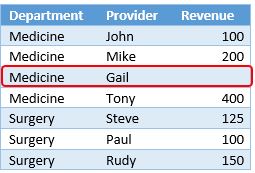
I’m using my previous example which is a list of providers in different hospital clinical departments, I want to rank department and rank providers in each department by revenue (two ranking levels). Here is my sample table I started with creating a table in Excel “Table1” and add it to Power Pivot model.

clip_image001

I created following measures to rank provider by revenue:

TotalRevenue:=SUM(Table1[Revenue])

Rank:=RANKX(All(Table1[Provider]),[TotalRevenue],,,Dense)

The Rank measure will rank the [TotalRevenue] for the current Row against the [TotalRevenue] for all other rows in the Revenue column. The ALL(Table1[Provider]) is the list of values that the rank function use to compare the current row against. Since I used ALL function to ignore Provider filter context, I will get the following:

image

Now let’s add the department to pivot table and see how Rank measure works:

image

As you can see the Rank by provider still working within each department by the rank by department is not, it uses the department total and compare it against list of provider values. I want to rank each department against all departments, and rank providers within each department. In order to do that in Power Pivot, I want to create an IsDepartmentLevel measure that will return TRUE if the current selection in the PivotTable has a valid correspondent department definition, FALSE otherwise. If it is TRUE, Rank department, otherwise Rank providers. Let’s see how to write the IsDepartmentLevel measure:

IsDeptartmentLevel:=(

                                                 COUNTROWS(Table1)

                                                 =

                                                 CALCULATE(COUNTROWS(Table1) ,

                                                                          ALL(Table1),

                                                                           VALUES(Table1[Department])

                                                                          )

                                              )


The IsDepartmentLevel measure checks that the number of rows that are active in Table1 equal to the number of rows that would be active by removing from the filter context any column except Department.

As you can see in the following Pivot table, I added the IsDepartmentLevel measure to Pivot table, the IsDepartmentLevel measure is FALSE for every provider level but TRUE for department.

image

Now we are able to identify the department level which we need in order to evaluate the Rank measure and Rank department vs. provider.

Let’s re-write the Rank measure and see how to use the IsDepartmentLevel measure and RANKX function to rank departments and providers by revenue.

Rank:= IF(

                    [IsDeptartmentLevel],

                    RANKX(Filter(All(Table1[Department]), [TotalRevenue]),[TotalRevenue],,,Dense),

                    RANKX(Filter(All(Table1[Provider]), [TotalRevenue]),[TotalRevenue],,,Dense)

                  )

I used IF function to evaluate IsDepartmentLevel measure, if it is TRUE, it will calculate the revenue ranking for each department, otherwise it will calculate the revenue ranking for each provider.

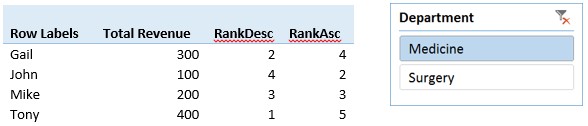
The following Pivot table shows the ranking for each department.

image

When I expand the departments, it shows the ranking for each provider in each department and maintained the ranking for each department.

image

In this post, you have seen how to use RANKX function and calculate at different levels (department and provider) using one measure.

SSAS Tabular using HiveODBC connection

1_Hive-to-BISM

In my previous blog post “Import Hadoop Data into BI Semantic Model Tabular”, I mentioned that you need a SQL Server Linked Server connection to connect SSAS Tabular to a Hive table in Hadoop. That is the case with SSAS Multidimensional instance but in a Tabular instance you can connect directly to Hive table. Thanks to Lara Rubbelke (Technical Architect at Microsoft) who brought to my attention that we can connect a SSAS Tabular project to Hive via HiveODBC connection directly.

After few testing scenarios, we were able to get it to work. Here is how? Running SQL Server Analysis Services 2012 Tabular mode 64-bit on a 64-bit operating system, after creating an SSAS Tabular project using SQL Server Data Tools (SSDT), you have to create both a 32-bit and 64-bit System DSN for this to work. When you create the SSAS import task, you are doing it from SQL Server Data Tools (SSDT), which is a 32-bit process, so it can only see 32-bit DSNs. On a 64-bit operating system, the DSNs are 64-bit by default, so they don’t show up. User DSNs are automatically both 32 and 64bit, so they don’t have this problem. This is a quirk of ODBC and isn’t specific to this driver.

To create a 32-bit DSN, run c:\windows\syswow64\odbcad32.exe and create the System DSN there, and also create an identical one (same name and everything) in the regular 64-bit ODBC Data Source Administrator that is launched from the control panel. When you create the import task from SSDT, it will pick the 32-bit one and then at runtime when the import happens, it will look for the 64-bit one and use it instead. As long as they are identical this is fine.


Project “ChâteauKebob”

Authors: Ayad Shammout & Denny Lee

Kebob

It may sound like a rather odd name for an End-to-End Auditing Compliance project – and the roots admittedly enough are based on the authors’ prediliction toward great food in the city of Montréal – but there actually is an analogous association!

Château means manor house or palace and kebob refers to meat that is cooked over or next to flames; large or small cuts of meat, or even ground meat, it may be served on plates, or in sandwiches (mouth watering yet).  Château Kebob means house of kebob with different meat.

So why did we call our project “ChâteauKebob”? In this project Denny Lee and I used a château of different technologies in one framework or house with Kebob of mixed of data small or big data, structured and unstructured, and served on plates or in sandwiches, … sorry I meant served with multiple BI tools for reporting and analysis.

The purpose of this project is to provide a set of tools and jumpstart with scripts to implement the project involving HDInsight (Hadoop), SQL Server 2012, SQL Server Analysis Services 2012, Excel 2013 PowerPivot and Power View. You can review an overview of the project at slideshare .

The SDK is available at GitHub to download the entire project.


SSWUG Summer Camp

SummerCampLogo

On July 9-11, I will be presenting a cool session on “Building BI Semantic Model Tabular in 60 minutes” at the SSWUG SUMMER CAMP event. It is a virtual event where you’ll have access to the video sessions right at your computer with live interaction. This event is bringing you great how-to information and real-world solutions on everything from SQL Server, SharePoint, Business Intelligence, Security, Cloud and Development.

Don’t miss it and join us at the Conference.

Import Hadoop Data into Analysis Services Tabular

 1_Hive-to-BISM

Hadoop brings scale and flexibility that don’t exist in the traditional data warehouse. Using Hive as a data warehouse for Hadoop to facilitate easy data summarization, ad-hoc queries, and the analysis of large datasets. Although Hive supports ad-hoc queries for Hadoop through HiveQL, query performance is often prohibitive for even the most common BI scenarios.

A better solution is to bring relevant Hadoop data into SQL Server Analysis Services Tabular model by using HiveQL. Analysis Services can then serve up the data for ad-hoc analysis and reporting. But, there is no direct way to connect an Analysis Services Tabular database to Hadoop. A common workaround is to create a Linked Server in a SQL Server instance using HiveODBC which uses it through OLE DB for ODBC. The HiveODBC driver can be downloaded from here.

Create a Hive ODBC Data Source

The following steps show you how to create a Hive ODBC Data Source.

  1. Click Start -> Control Panel to launch the Control Panel for Microsoft Windows.
  2. In the Control Panel, click System and Security->Administrative Tools. Then click Data Sources. This will launch the ODBC Data Source Administrator dialog.

2_HiveODBC

  1. In the ODBC Data Source Administrator dialog, click the System DSN tab.
  2. Click Add to add a new data source.
  3. Click the HIVE driver in the ODBC driver list.

3_HiveODBC

  1. Click the Finish button. This will launch the Hive Data Source Configuration dialog.

4_HiveODBC

  1. Enter a data source a name in the Data Source Name box. In this example, SQLHive.
  2. In this example, we are connecting to HDInsight (Hadoop on Windows Azure). In the Host box, replace the clustername placeholder variable with the actual name of the cluster that you created. For example, if your cluster name is “HDCluster1” then the final value for host should be “HDCluster1.azurehdinsight.net”. Do not change the default port number of 563 or the default value of the Hive Server HTTP Path, /servlets/thrifths2. If you are connecting to Hadoop cluster, the port number would be 10000.
  3. Click OK to close the ODBC Hive Setup dialog.

Once the HiveODBC driver is installed and created, next you will create a SQL Server Linked Server connection for HiveODBC.

SQL Server can serve as an intermediary and Analysis Server can connect to Hadoop via Hive Linked Server connection in SQL Server, so Hive appears as an OLE DB-based data source to Analysis Services.

The following components need to be configured to establish connectivity between a relational SQL Server instance and the Hadoop/Hive table:

  • A system data source name (DSN) “SQLHive” for the Hive ODBC connection that we created in the steps above.
  • A linked server object. The Transact-SQL script illustrates how to create a linked server that points to a Hive data source via MSDASQL. The system DSN in this example is called “SQLHive”.

                EXEC master.dbo.sp_addlinkedserver
                               @server = N’SQLHive’, @srvproduct=N’HIVE’,
                               @provider=N’MSDASQL’, @datasrc=N’SQLHive’,
                               @provstr=N’Provider=MSDASQL.1;Persist Security Info=True;
                               User ID=UserName; Password=pa$$word;

             Note: Replace the User ID “UserName” and password “pa$$word” with a valid
username and password to connect to Hadoop.

  • SQL statement that is based on an OpenQuery Transact-SQL command. The OpenQuery command connects to the data source, runs the query on the target system, and returns the ResultSet to SQL Server. The following Transact-SQL script illustrates how to query a Hive table from SQL Server:

                             SELECT * FROM OpenQuery(SQLHive, ‘SELECT * FROM HiveTable;’)

Where “HiveTable” is the name of Hadoop Hive table, you can replace the name with the actual Hive table name.

Once the Linked Server is created on the computer running SQL Server, it is straightforward to connect Analysis Services to Hive in SQL Server Data Tools. You can start by creating a new SQL Analysis Services Tabular project

Create a BI Semantic Model Tabular project and connect to a Hadoop Hive table

The steps below describe the way to import data from a hive table into new SSAS Tabular model using the Linked Server connection that you created in the steps above.

To create a new tabular model project

  1. In SQL Server Data Tools, on the File menu, click New, and then click Project.
  2. In the New Project dialog box, under Installed Templates, click Business Intelligence, then click Analysis Services, and then click Analysis Services Tabular Project.
  3. In Name, type Hive Tabular Model, then specify a location for the project files. By default, Solution Name will be the same as the project name, however, you can type a different solution name.
  4. Click OK.
  5. In SQL Server Data Tools, click on the Model menu, and then click Import from Data Source. This launches the Table Import Wizard which guides you through setting up a connection to a data source.
  6. In the Table Import Wizard, under Relational Databases, click Microsoft SQL Server, and then click Next.
  7. In the Connect to a Microsoft SQL Server Database page, in Friendly Connection Name, type SQLHive DB from SQL.
  8. In Server name, type the name of the SQL Server database that hosts the SQL Linked Server connection to Hadoop/Hive.
  9. In the Database name field, click the down arrow and select master, and then click Next.
  10. In the Impersonation Information page, you need to specify the credentials Analysis Services will use to connect to the data source when importing and processing data. Verify Specific Windows user name and password is selected, and then in User Name and Password, enter your Windows logon credentials, and then click Next.
  11. In the Choose How to Import the Data page, verify write a query that will specify the data to import is selected. Rename the query name to friendly name  and in the SQL Statement window, type the following:                                                                                                     SELECT * FROM OpenQuery (SQLHive, ‘SELECT * FROM HiveTable;’)
  12. And then click Finish.
  13. Once the above table was imported, you can import additional dimensions and you can create a relationships between the tables.
  14. Now the Model is ready to be deployed to SQL Server Analysis Services (SSAS) Tabular instance.

The Hive ODBC driver makes it easy to import data from your Hadoop Hive table into SQL Server Analysis Services Tabular instance database where Business Intelligence tools may be used to view and analyze the data.

Healthcare Compliance with Big Data and BI

Healthcare Compliance with Big Data and BI

Over the past few years Denny Lee  (Technical Principal Program Manager within Microsoft’s SQL Business Intelligence Group) and I are always working on a very exciting SQL Server projects, earlier this month we presented “Big Data, BI, and Compliance in Healthcare” at PASS BA Conference in Chicago, IL.

Few years ago, we implemented “Centralized Audit Framework” to manage and view the audits of entire SQL Server environment that will parse, load, and report all of audit logs.

Expanding on the “Reaching Compliance: SQL Server 2008 Compliance Guide” to more easily handle larger volumes of structured and unstructured data and to gain richer and deeper insight using the latest analytics. To achieve this, we are building a Big Data-to-BI project involving HDInsight (Hadoop on Windows or Azure), SQL Server 2012, SQL Server Analysis Service 2012 Tabular instance, Integration Services, PowerPivot, and Power View.

The purpose of this SDK is to provide a set of tools and jumpstart with scripts to implement the Auditing project involving HDInsight, SQL Server 2012, PowerPivot and Power View.

Implementation Overview

The basic implementation of the Auditing and Reporting solution is shown in the figure below.

BigData_BI_diagram

Figure 2

The general flow of data in this solution is that Audits are created on any number of SQL Servers (2008 and 2012) in the environment and are set to log to the file system. The audit logs will be stored directly to a central network file share. A scheduled SQL Server Agent Job runs an SSIS package that reads the audit log files, combines them into large file sizes (250MB to 1GB file size) and uploads them to HDInsight Blob Storage which is the storage source for HDInsight on Azure or Windows.

Once audit logs stored in HDInsight Blob storage, we use Hive which is a data warehouse framework for Hadoop that facilitates easy data summarization, ad-hoc queries, and the analysis of large datasets.

Create a BI Semantic Data Model tabular to bring relevant Hadoop data into SQL Server Analysis Services Tabular by using HiveQL via SQL Server Linked Server connection to Hadoop Hive. Analysis Services can then serve up the data for ad-hoc analysis and reporting.

Reports are created with Excel 2013 using Power View that interacts with views of data from data models based on SSAS tabular model, or using Data Explorer to import audit data from Hive external table in HDInsight to allow compliance auditors and server administrators to assess the server compliance and trends in server compliance.

This information would then be fed back to the appropriate security, administrator and application development teams to enact policies to approve levels of compliance.

As the system evolves, teams may load additional application audit logs into Hadoop which could help tie these SQL Server specific activities to application and business activities.

The SDK will be available soon at GitHub to download the entire project. Stay tuned!

DAX RANKX function scenarios

RANKX is a DAX function introduced in SQL Server PowerPivot 2012. It returns the ranking of a number in a list of numbers for each row in the table argument. For more information about RANKX, please click here .

Let’s see it in action, here is my scenario

I have a list of hospital clinical departments (to simplify the example, I’m using 2 departments) and would like to rank the providers in each department by revenue. I started with creating a table in Excel “Table1” and add it to PowerPivot model.

1-Rankx-Table1

I used the following measures to create a simple Rank function:

TotalRevenue:=SUM([Revenue])

RankDesc:=RANKX(All(Table1[Provider]),[TotalRevenue],,,Dense)

RankAsc:=RANKX(All(Table1[Provider]),[TotalRevenue],,1,Dense)

The RankAsc and RankDesc measures will rank the [TotalRevenue] for the current Row against the [TotalRevenue] for all the other rows in the Revenue column. The ALL(Table1[Provider]) is the list of values that the rank function use to compare the current row against. The difference between the two rank measures is the Order of rank value (low to high or high to low). One thing to notice here is that I use an existing measure TotalRevenue.

Using the above RANK measures get the following ranking:

2-Rankx-Result1

Now, when I filter on Medicine department, I get the following

3-Rankx-Result3

The descending rank works ok but the ascending rank starts with 2, why is that?

Let me explain, I was ranking the set of providers in ALL(Table1[Provider]) which includes everyone, not just the folks in the one department.

When I filter on Medicine, the folks who are not in the Medicine department are still in the set that is being ranked. The use of ALL() means that I am ranking against an unfiltered set of all the providers, not just the providers in the selected department.

To fix this issue, I’ve modified the measure for RankAsc, here is the formula instead:

RankAsc=RANKX(FILTER(All(Table1[Provider]),[TotalRevenue]),[TotalRevenue],,1,Dense)

The part I added is highlighted in red, and it says to only consider the providers who have non-zero revenue.

Now, when I view the pivot table and filter on Medicine, as you can see it is ranking correctly,

4-Rankx-Result4

So far so good, but what if I have a provider with no revenue (NULL value) in the Medicine department. I replaced the provider “Gail” revenue with NULL value.

5-Rankx-Result5

Refreshing the pivot table,

6-Rankx-Result6_1

As you can see above, that Gail is Rank = 1 in ascending order, that is because the RANK =1 position is going to the items that are tied with no data.  In other words, if there are any items in the column for whom the measure is BLANK(), they would all be tied for position =1 when you rank in ascending order.

So to fix this issue, I modified the DAX formula to:

RankAsc=IF(NOT(ISBLANK([TotalRevenue])),RANKX(FILTER(All(Table1[Provider]),[TotalRevenue]),[TotalRevenue],,1,Dense), BLANK())

RankDesc=IF(NOT(ISBLANK([TotalRevenue])),RANKX(FILTER(All(Table1[Provider]),[TotalRevenue]),[TotalRevenue],,,Dense), BLANK())

The above formula will check the TotalRevenue measure for a provider, if it is not blank then rank, otherwise ignore it.

I got the required result which doesn’t show a rank for a NULL value.

7-Rankx-Result7

This just a simple example but you can do much more with the Rankx function.

Upgrade Tabular Model project to SQL 2012 SP1

SQL Server 2012 SP1 introduces new features for Analysis Services running in Tabular mode, including optimized storage for measures and KPIs, extended data categorizations, extended characters, hierarchy annotation, and improved support when importing from Data Market data feeds. In some cases, Tabular model projects being deployed may not be compatible with an Analysis Services deployment server instance. With SP1 applied, you can specify Compatibility Level when creating new Tabular model projects, when upgrading existing Tabular model projects, when upgrading existing deployed Tabular model databases, or when importing PowerPivot workbooks.

So in order to be completely running the latest SQL 2012 Service Pack 1 in your environment, you need to upgrade SQL Server Analysis Services Server (SSAS) Tabular mode, Tabular Model projects and Tabular Model databases separately.

In our environment, the SSAS Tabular deployment server and workspace server are separate, we have SSAS production and test where all Tabular Model databases have been deployed and a dedicated workspace SSAS server so developer can use it for Tabular Model workspace database. After we installed SP1 on SSAS Prod/Test and Workspace Server, I ran into an issue where I couldn’t open and load the Model.bim file inside the Tabular Model Project and generated an error:

Error: (STRING REVIEW) Please open BIM file in Tabular Designer in order to view or change compatibility level (See screenshot below with error message in Compatibility Level)

1_complevelerror

When I tried to Open Model.bim file again, I got a different error message Error:

2_openBIMfileError

============================

Error Message:

============================

Tabular databases do not support Compatibility Level downgrade.

In order to resolve this issue, I found a workaround where I was able to upgrade my Tabular Model project to SP1 and deployed it to SSAS Tabular mode server.

So, back to the Model.bim properties page, change the Workspace server to another SSAS Tabular SP1 server

After entering a different Workspace server name, hit Enter, you will be prompted with the following window, click Apply Change to connect to the new SSAS Tabular SP1 server

4_ChangeWorkspaceServerWarning

Now you can open the Model.bim file. To upgrade the Model.bim to SP1, right click on Model.bim, select properties and change the Compatibility Level to SQL Server SP1

5_ChangeCompLevel

Once, you changed the Compatibility Level to SP1, another windows will prompt you with the following message, click Yes

6_ChangeCompLevelWarning

After click yes, the Model.bim file will close and re-open again with new compatibility level

7_Final

Now, your BISM project is upgraded successfully to SP1, you can change the workspace server back to the original one.