DAX RANKX function – Part II

In a previous post, I explained how to use RANKX function to calculate revenue ranking for each provider in each department. In this post I’m going to explain how to rank at different levels.

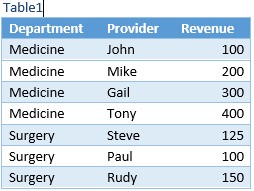
I’m using my previous example which is a list of providers in different hospital clinical departments, I want to rank department and rank providers in each department by revenue (two ranking levels). Here is my sample table I started with creating a table in Excel “Table1” and add it to Power Pivot model.

clip_image001

I created following measures to rank provider by revenue:

TotalRevenue:=SUM(Table1[Revenue])

Rank:=RANKX(All(Table1[Provider]),[TotalRevenue],,,Dense)

The Rank measure will rank the [TotalRevenue] for the current Row against the [TotalRevenue] for all other rows in the Revenue column. The ALL(Table1[Provider]) is the list of values that the rank function use to compare the current row against. Since I used ALL function to ignore Provider filter context, I will get the following:

image

Now let’s add the department to pivot table and see how Rank measure works:

image

As you can see the Rank by provider still working within each department by the rank by department is not, it uses the department total and compare it against list of provider values. I want to rank each department against all departments, and rank providers within each department. In order to do that in Power Pivot, I want to create an IsDepartmentLevel measure that will return TRUE if the current selection in the PivotTable has a valid correspondent department definition, FALSE otherwise. If it is TRUE, Rank department, otherwise Rank providers. Let’s see how to write the IsDepartmentLevel measure:

IsDeptartmentLevel:=(

                                                 COUNTROWS(Table1)

                                                 =

                                                 CALCULATE(COUNTROWS(Table1) ,

                                                                          ALL(Table1),

                                                                           VALUES(Table1[Department])

                                                                          )

                                              )


The IsDepartmentLevel measure checks that the number of rows that are active in Table1 equal to the number of rows that would be active by removing from the filter context any column except Department.

As you can see in the following Pivot table, I added the IsDepartmentLevel measure to Pivot table, the IsDepartmentLevel measure is FALSE for every provider level but TRUE for department.

image

Now we are able to identify the department level which we need in order to evaluate the Rank measure and Rank department vs. provider.

Let’s re-write the Rank measure and see how to use the IsDepartmentLevel measure and RANKX function to rank departments and providers by revenue.

Rank:= IF(

                    [IsDeptartmentLevel],

                    RANKX(Filter(All(Table1[Department]), [TotalRevenue]),[TotalRevenue],,,Dense),

                    RANKX(Filter(All(Table1[Provider]), [TotalRevenue]),[TotalRevenue],,,Dense)

                  )

I used IF function to evaluate IsDepartmentLevel measure, if it is TRUE, it will calculate the revenue ranking for each department, otherwise it will calculate the revenue ranking for each provider.

The following Pivot table shows the ranking for each department.

image

When I expand the departments, it shows the ranking for each provider in each department and maintained the ranking for each department.

image

In this post, you have seen how to use RANKX function and calculate at different levels (department and provider) using one measure.

SSWUG Summer Camp

SummerCampLogo

On July 9-11, I will be presenting a cool session on “Building BI Semantic Model Tabular in 60 minutes” at the SSWUG SUMMER CAMP event. It is a virtual event where you’ll have access to the video sessions right at your computer with live interaction. This event is bringing you great how-to information and real-world solutions on everything from SQL Server, SharePoint, Business Intelligence, Security, Cloud and Development.

Don’t miss it and join us at the Conference.

DAX RANKX function scenarios

RANKX is a DAX function introduced in SQL Server PowerPivot 2012. It returns the ranking of a number in a list of numbers for each row in the table argument. For more information about RANKX, please click here .

Let’s see it in action, here is my scenario

I have a list of hospital clinical departments (to simplify the example, I’m using 2 departments) and would like to rank the providers in each department by revenue. I started with creating a table in Excel “Table1” and add it to PowerPivot model.

1-Rankx-Table1

I used the following measures to create a simple Rank function:

TotalRevenue:=SUM([Revenue])

RankDesc:=RANKX(All(Table1[Provider]),[TotalRevenue],,,Dense)

RankAsc:=RANKX(All(Table1[Provider]),[TotalRevenue],,1,Dense)

The RankAsc and RankDesc measures will rank the [TotalRevenue] for the current Row against the [TotalRevenue] for all the other rows in the Revenue column. The ALL(Table1[Provider]) is the list of values that the rank function use to compare the current row against. The difference between the two rank measures is the Order of rank value (low to high or high to low). One thing to notice here is that I use an existing measure TotalRevenue.

Using the above RANK measures get the following ranking:

2-Rankx-Result1

Now, when I filter on Medicine department, I get the following

3-Rankx-Result3

The descending rank works ok but the ascending rank starts with 2, why is that?

Let me explain, I was ranking the set of providers in ALL(Table1[Provider]) which includes everyone, not just the folks in the one department.

When I filter on Medicine, the folks who are not in the Medicine department are still in the set that is being ranked. The use of ALL() means that I am ranking against an unfiltered set of all the providers, not just the providers in the selected department.

To fix this issue, I’ve modified the measure for RankAsc, here is the formula instead:

RankAsc=RANKX(FILTER(All(Table1[Provider]),[TotalRevenue]),[TotalRevenue],,1,Dense)

The part I added is highlighted in red, and it says to only consider the providers who have non-zero revenue.

Now, when I view the pivot table and filter on Medicine, as you can see it is ranking correctly,

4-Rankx-Result4

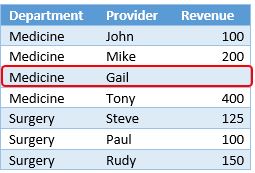
So far so good, but what if I have a provider with no revenue (NULL value) in the Medicine department. I replaced the provider “Gail” revenue with NULL value.

5-Rankx-Result5

Refreshing the pivot table,

6-Rankx-Result6_1

As you can see above, that Gail is Rank = 1 in ascending order, that is because the RANK =1 position is going to the items that are tied with no data.  In other words, if there are any items in the column for whom the measure is BLANK(), they would all be tied for position =1 when you rank in ascending order.

So to fix this issue, I modified the DAX formula to:

RankAsc=IF(NOT(ISBLANK([TotalRevenue])),RANKX(FILTER(All(Table1[Provider]),[TotalRevenue]),[TotalRevenue],,1,Dense), BLANK())

RankDesc=IF(NOT(ISBLANK([TotalRevenue])),RANKX(FILTER(All(Table1[Provider]),[TotalRevenue]),[TotalRevenue],,,Dense), BLANK())

The above formula will check the TotalRevenue measure for a provider, if it is not blank then rank, otherwise ignore it.

I got the required result which doesn’t show a rank for a NULL value.

7-Rankx-Result7

This just a simple example but you can do much more with the Rankx function.