Healthcare Compliance with Big Data and BI

Healthcare Compliance with Big Data and BI

Over the past few years Denny Lee  (Technical Principal Program Manager within Microsoft’s SQL Business Intelligence Group) and I are always working on a very exciting SQL Server projects, earlier this month we presented “Big Data, BI, and Compliance in Healthcare” at PASS BA Conference in Chicago, IL.

Few years ago, we implemented “Centralized Audit Framework” to manage and view the audits of entire SQL Server environment that will parse, load, and report all of audit logs.

Expanding on the “Reaching Compliance: SQL Server 2008 Compliance Guide” to more easily handle larger volumes of structured and unstructured data and to gain richer and deeper insight using the latest analytics. To achieve this, we are building a Big Data-to-BI project involving HDInsight (Hadoop on Windows or Azure), SQL Server 2012, SQL Server Analysis Service 2012 Tabular instance, Integration Services, PowerPivot, and Power View.

The purpose of this SDK is to provide a set of tools and jumpstart with scripts to implement the Auditing project involving HDInsight, SQL Server 2012, PowerPivot and Power View.

Implementation Overview

The basic implementation of the Auditing and Reporting solution is shown in the figure below.
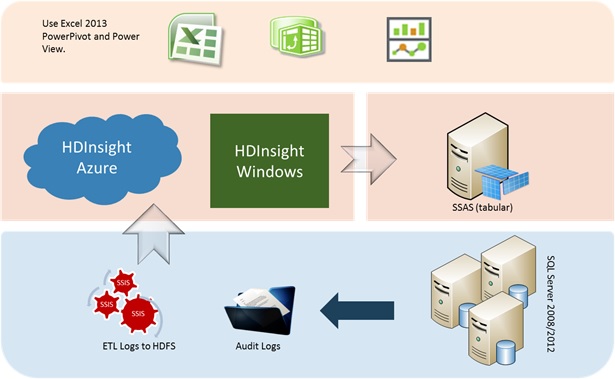
BigData_BI_diagram

Figure 2

The general flow of data in this solution is that Audits are created on any number of SQL Servers (2008 and 2012) in the environment and are set to log to the file system. The audit logs will be stored directly to a central network file share. A scheduled SQL Server Agent Job runs an SSIS package that reads the audit log files, combines them into large file sizes (250MB to 1GB file size) and uploads them to HDInsight Blob Storage which is the storage source for HDInsight on Azure or Windows.

Once audit logs stored in HDInsight Blob storage, we use Hive which is a data warehouse framework for Hadoop that facilitates easy data summarization, ad-hoc queries, and the analysis of large datasets.

Create a BI Semantic Data Model tabular to bring relevant Hadoop data into SQL Server Analysis Services Tabular by using HiveQL via SQL Server Linked Server connection to Hadoop Hive. Analysis Services can then serve up the data for ad-hoc analysis and reporting.

Reports are created with Excel 2013 using Power View that interacts with views of data from data models based on SSAS tabular model, or using Data Explorer to import audit data from Hive external table in HDInsight to allow compliance auditors and server administrators to assess the server compliance and trends in server compliance.

This information would then be fed back to the appropriate security, administrator and application development teams to enact policies to approve levels of compliance.

As the system evolves, teams may load additional application audit logs into Hadoop which could help tie these SQL Server specific activities to application and business activities.

The SDK will be available soon at GitHub to download the entire project. Stay tuned!

DAX RANKX function scenarios

RANKX is a DAX function introduced in SQL Server PowerPivot 2012. It returns the ranking of a number in a list of numbers for each row in the table argument. For more information about RANKX, please click here .

Let’s see it in action, here is my scenario

I have a list of hospital clinical departments (to simplify the example, I’m using 2 departments) and would like to rank the providers in each department by revenue. I started with creating a table in Excel “Table1” and add it to PowerPivot model.

1-Rankx-Table1

I used the following measures to create a simple Rank function:

TotalRevenue:=SUM([Revenue])

RankDesc:=RANKX(All(Table1[Provider]),[TotalRevenue],,,Dense)

RankAsc:=RANKX(All(Table1[Provider]),[TotalRevenue],,1,Dense)

The RankAsc and RankDesc measures will rank the [TotalRevenue] for the current Row against the [TotalRevenue] for all the other rows in the Revenue column. The ALL(Table1[Provider]) is the list of values that the rank function use to compare the current row against. The difference between the two rank measures is the Order of rank value (low to high or high to low). One thing to notice here is that I use an existing measure TotalRevenue.

Using the above RANK measures get the following ranking:

2-Rankx-Result1

Now, when I filter on Medicine department, I get the following

3-Rankx-Result3

The descending rank works ok but the ascending rank starts with 2, why is that?

Let me explain, I was ranking the set of providers in ALL(Table1[Provider]) which includes everyone, not just the folks in the one department.

When I filter on Medicine, the folks who are not in the Medicine department are still in the set that is being ranked. The use of ALL() means that I am ranking against an unfiltered set of all the providers, not just the providers in the selected department.

To fix this issue, I’ve modified the measure for RankAsc, here is the formula instead:

RankAsc=RANKX(FILTER(All(Table1[Provider]),[TotalRevenue]),[TotalRevenue],,1,Dense)

The part I added is highlighted in red, and it says to only consider the providers who have non-zero revenue.

Now, when I view the pivot table and filter on Medicine, as you can see it is ranking correctly,

4-Rankx-Result4

So far so good, but what if I have a provider with no revenue (NULL value) in the Medicine department. I replaced the provider “Gail” revenue with NULL value.

5-Rankx-Result5

Refreshing the pivot table,

6-Rankx-Result6_1

As you can see above, that Gail is Rank = 1 in ascending order, that is because the RANK =1 position is going to the items that are tied with no data.  In other words, if there are any items in the column for whom the measure is BLANK(), they would all be tied for position =1 when you rank in ascending order.

So to fix this issue, I modified the DAX formula to:

RankAsc=IF(NOT(ISBLANK([TotalRevenue])),RANKX(FILTER(All(Table1[Provider]),[TotalRevenue]),[TotalRevenue],,1,Dense), BLANK())

RankDesc=IF(NOT(ISBLANK([TotalRevenue])),RANKX(FILTER(All(Table1[Provider]),[TotalRevenue]),[TotalRevenue],,,Dense), BLANK())

The above formula will check the TotalRevenue measure for a provider, if it is not blank then rank, otherwise ignore it.

I got the required result which doesn’t show a rank for a NULL value.

7-Rankx-Result7

This just a simple example but you can do much more with the Rankx function.